2015 CJC P2 Q2
Timothy Gan
2015 CJC P2 Q2
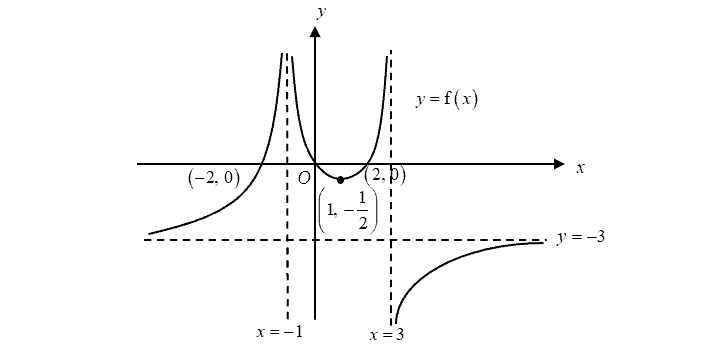
The diagram below shows the graph of $y=\text{f}(x)$. The curve has a minimum point at $\left( 1,\,\,-\frac{1}{2} \right)$ and crosses the $x$–axis at $\left( -2,\,\,0 \right)$, $\left( 0,0 \right)$ and $\left( 2,\,\,0 \right)$. The lines $x=-1$, $x=3$ and $y=-3$ are the asymptotes of the curve.

Sketch $y=\text{f }\!\!’\!\!\text{ }(x)$,
[3]
Suggested Video and Handwritten Solutions
Our H2 Math Tuition includes
- Question Bank with Video solutions to 1400+ questions
- Online Portal
- H2 Math Summary Notes
- Structured Curriculum and Notes
Share with your friends!
- No charge
- Unsubscribe anytime
Continue reading

List MF 27
What is the MF 27? The MF 27, set to replace the MF 26 from 2025, is a comprehensive formula sheet developed by the Ministry of Education Singapore in collaboration

Panic No More: What To Do The Day Before An Exam?
As you approach the final hours before your exam, remember that a balanced approach is key. A light review can keep the information fresh in your mind, while preparing your

How to Self-Monitor Your Learning (Taking charge of Your Learning)
As students, we embark on an educational journey filled with various subjects and skills to master. Think of it as sailing on a vast sea of learning, where each topic
