Hypothesis testing is a statistical method that uses data from a sample to draw inferences about a population parameter or a population probability distribution. A null hypothesis and an alternative hypothesis are stated for comparison. One of these hypotheses is accepted and the other is rejected based on sample data collected from the population of interest. When performing a hypothesis test, it is very important to decide on the significance level beforehand. A significance level that is too high can result in ignoring potential details in your data while a very low significance level can lead to inaccurate findings because of random chance. Thus, choosing the correct significance level is very important as it will affect whether you detect a statistically significant difference between the results of your various tests.
This free online revision course is specially designed for students to revise important topics from A Level H2 Maths. The course content is presented in an easy to study format with 5 essential questions, core concepts and explanation videos for each question. Please download the worksheet and try the questions yourself! Have fun learning with us, consider joining our tuition classes or online courses.
Exposure to Volatile Organic Compounds (VOCs), which have been identified in indoor air, is suspected as a cause of headaches and respiratory systems. Indoor plants have not only a positive psychological effect on humans, but may also improve the air quality. Certain species of indoor plants were found to be effective removers of VOCs.
A commonly known VOC is Benzene. The following data gives the benzene levels, $x$(in ppm) in $40$ test chambers containing the indoor plant Epipremnum aureum.
The initial mean Benzene level (in ppm) without Epipremnum aureum was found to be $26.0$.
(i)
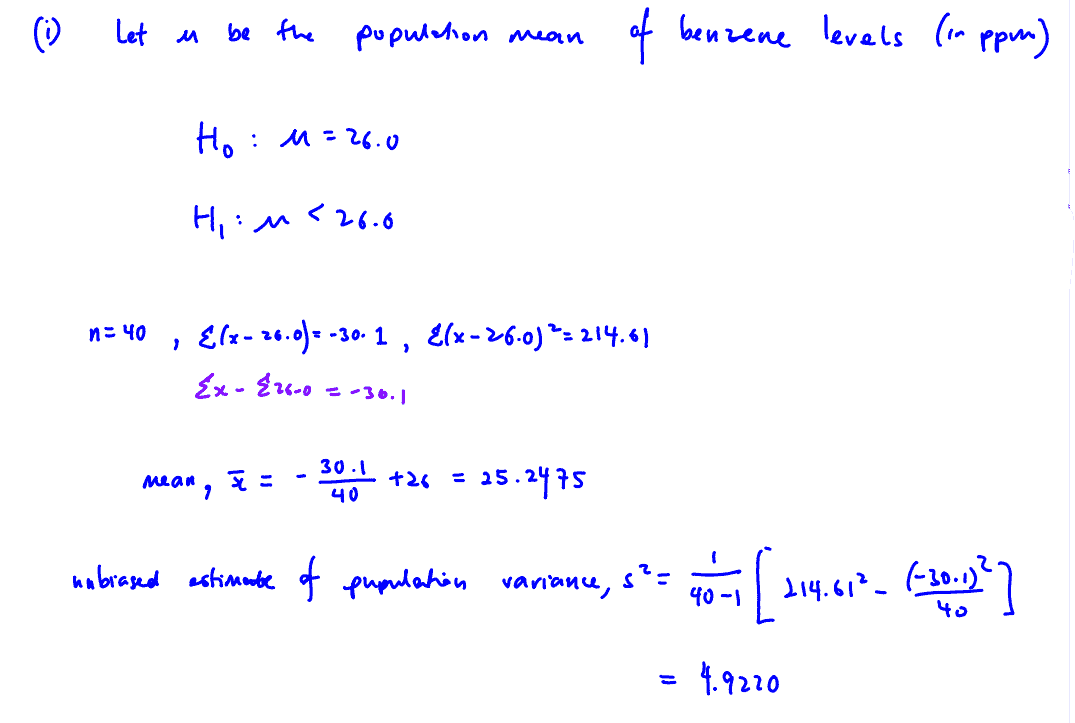
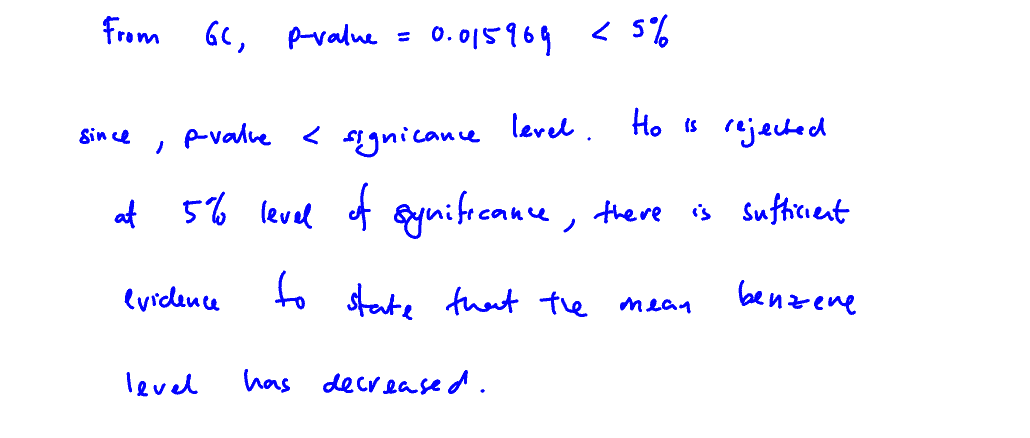
Test, at the $5$% level of significance, the claim that the mean Benzene level, $\mu $(in ppm), has decreased as a result of the indoor plant Epipremnum aureum. You should state your hypotheses clearly.
[5]
(i) Test, at the $5$% level of significance, the claim that the mean Benzene level, $\mu $(in ppm), has decreased as a result of the indoor plant Epipremnum aureum. You should state your hypotheses clearly.
[5]
(ii)
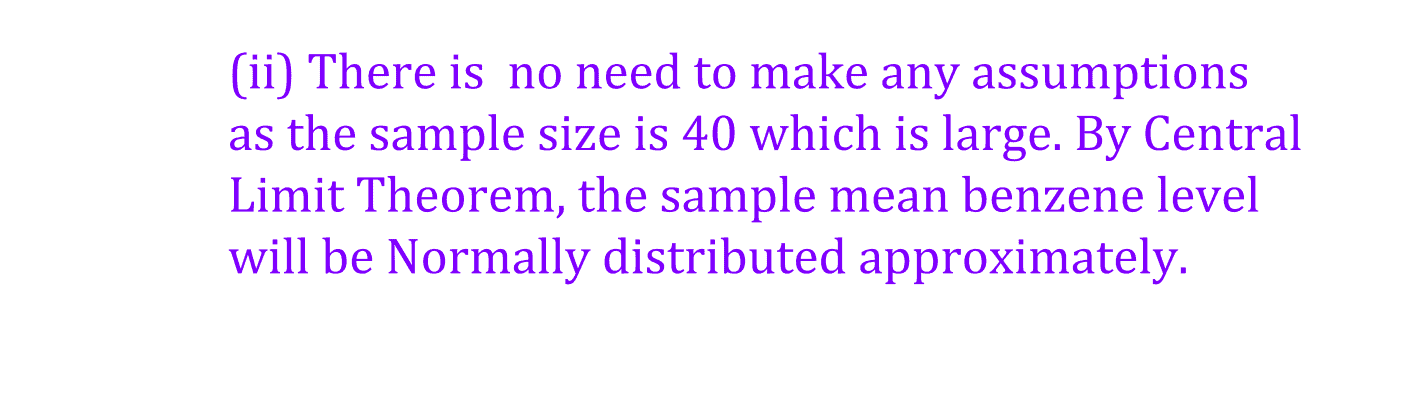
State, giving a reason, whether there is a need to make any assumptions about the population distribution of the Benzene level in order for the test to be valid.
[2]
(ii) State, giving a reason, whether there is a need to make any assumptions about the population distribution of the Benzene level in order for the test to be valid.
[2]
The Benzene levels of another $50$ test chambers containing the indoor plant Epipremnum aureum were recorded. The sample mean is $\bar{x}$ppm and the sample variance is $8.33$ ppm$^{2}$.
(iii)
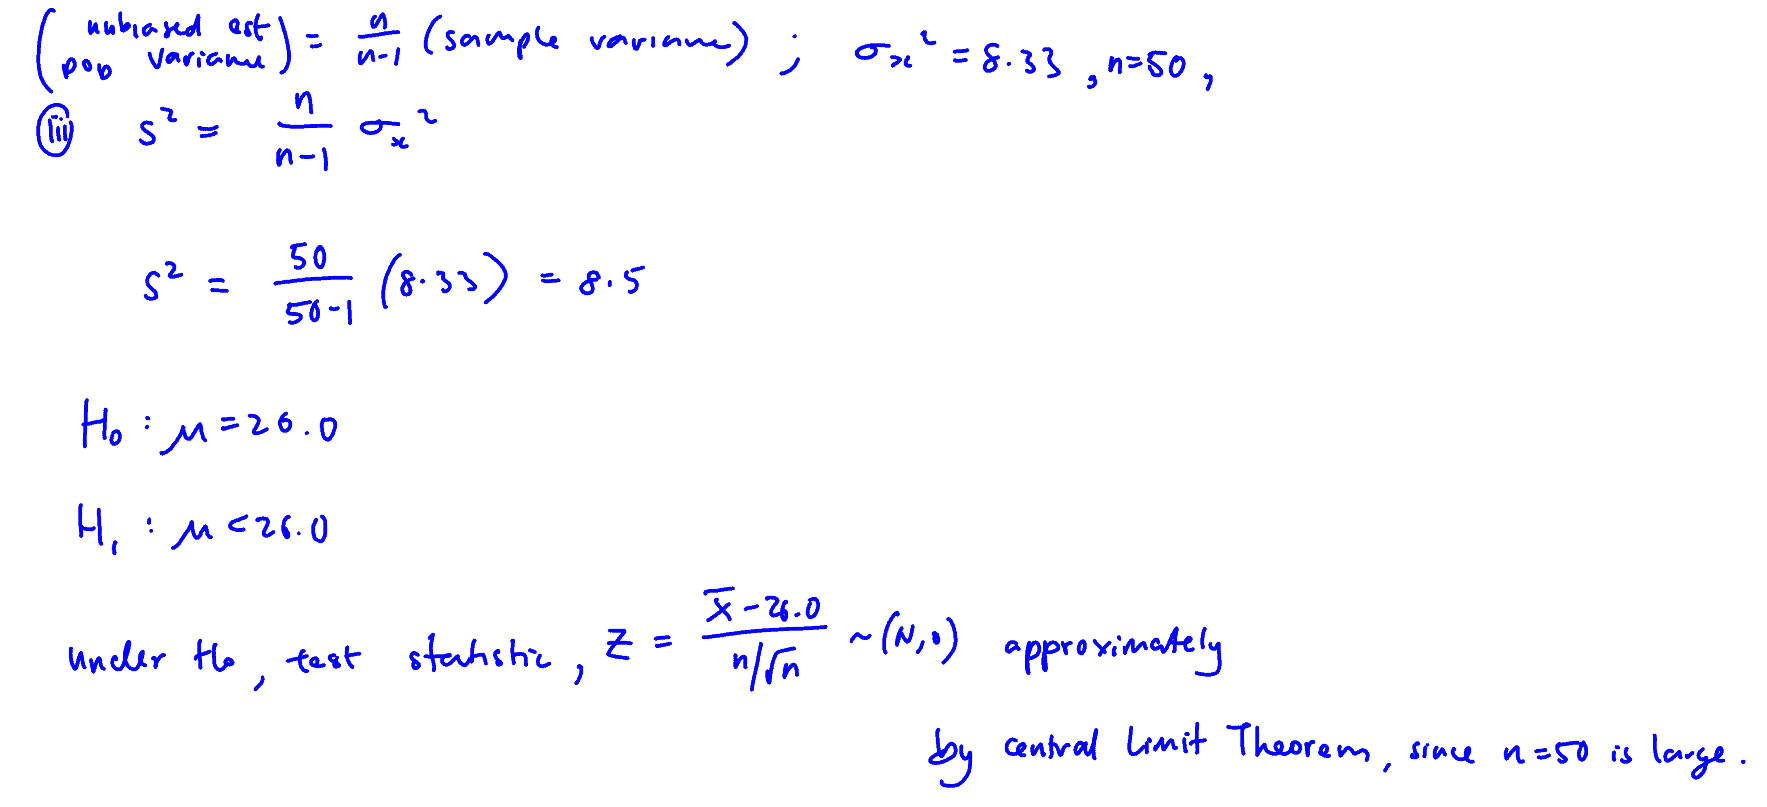
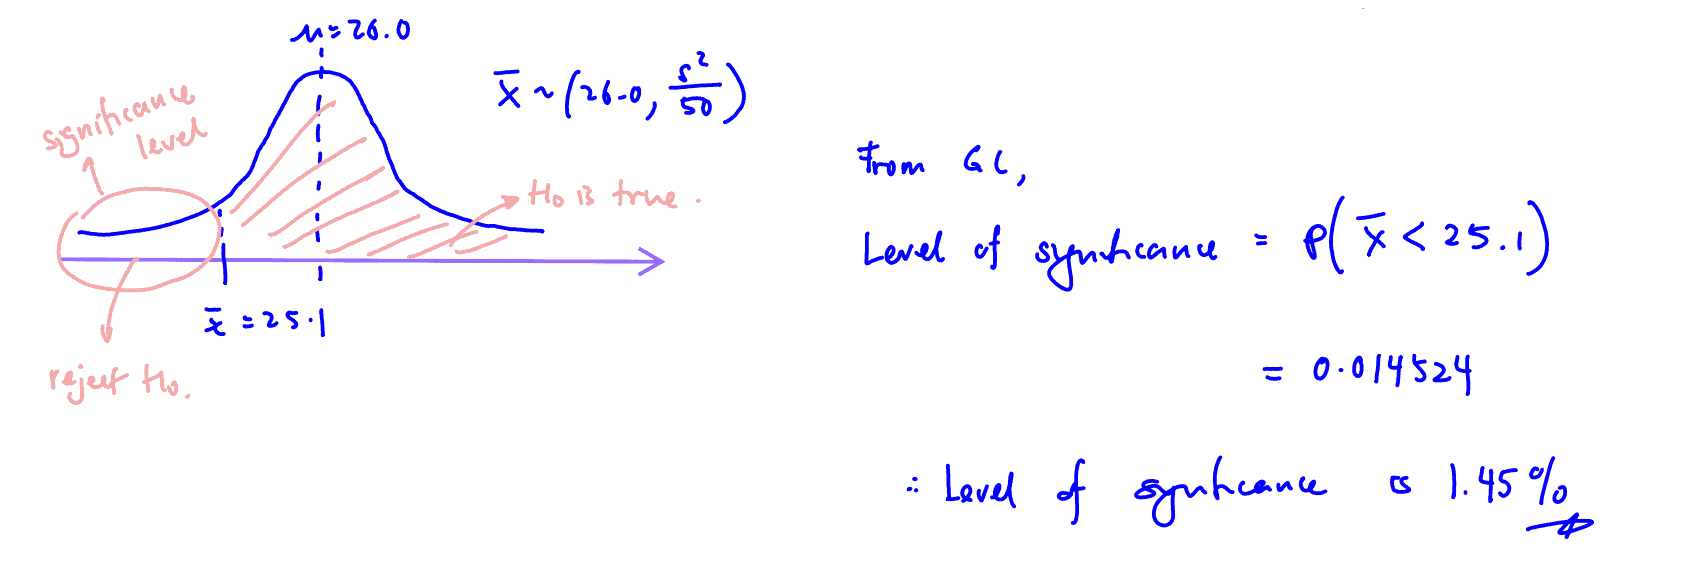
The acceptance region of a test of the null hypothesis $\mu =26.0$ is $\bar{x}>25.1$. State the alternative hypothesis and find the level of significance of the test.
[4]
(iii) The acceptance region of a test of the null hypothesis $\mu =26.0$ is $\bar{x}>25.1$. State the alternative hypothesis and find the level of significance of the test.
[4]
(iv)
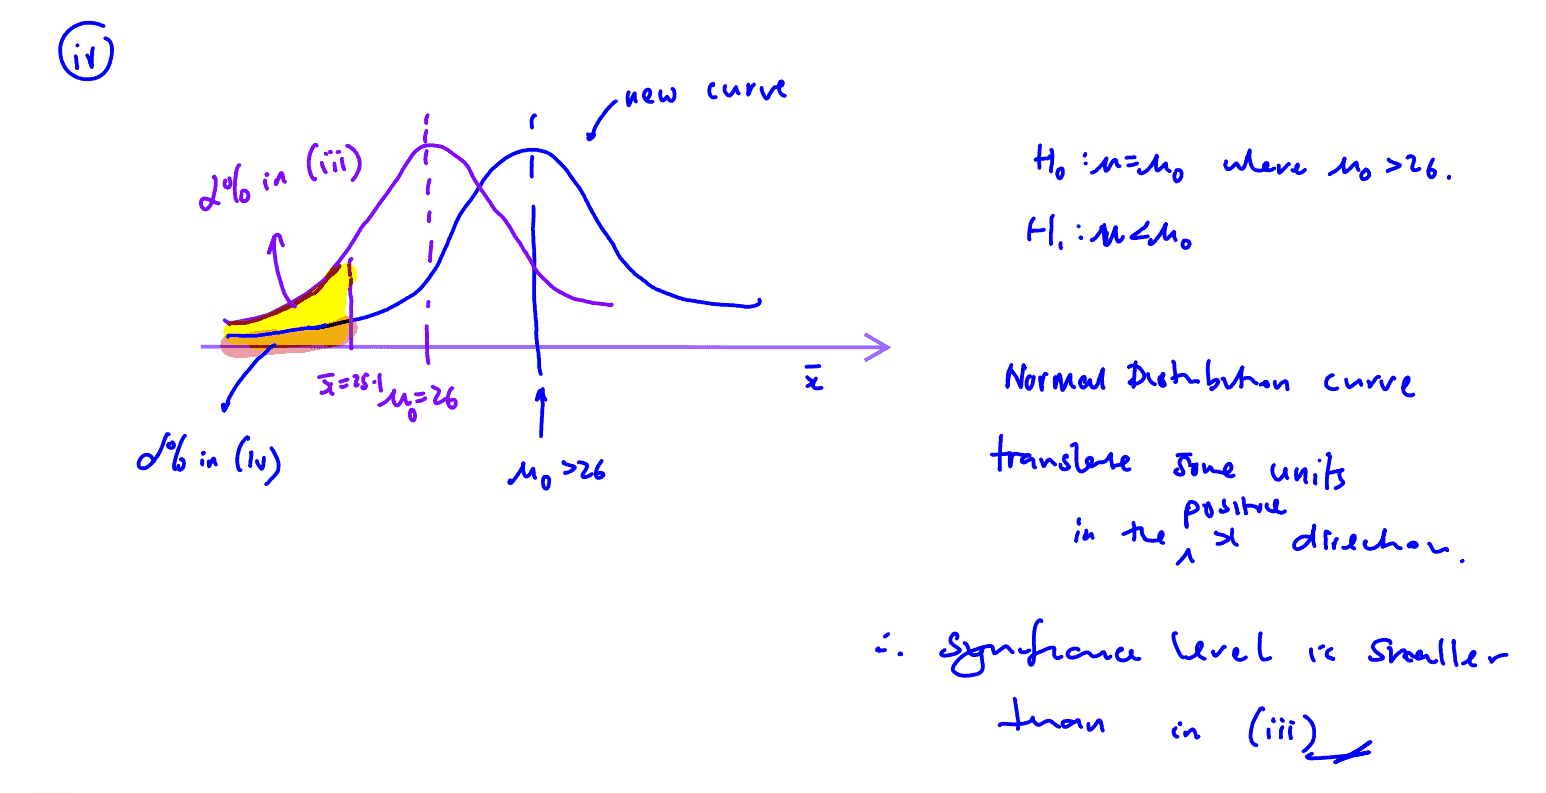
If the null hypothesis is $\mu ={{\mu }_{0}}$, where ${{\mu }_{0}}>26.0$, would the significance level of a test with the same acceptance region in part (iii) be larger or smaller than that found in (iii)? Give a reason for your answer.
[2]
(iv) If the null hypothesis is $\mu ={{\mu }_{0}}$, where ${{\mu }_{0}}>26.0$, would the significance level of a test with the same acceptance region in part (iii) be larger or smaller than that found in (iii)? Give a reason for your answer.
[2]
Suggested Handwritten and Video Solutions
(i)
(ii)
(iii)
(iv)
(i)
(ii)
(iii)
(iv)
Share with your friends!
WhatsApp
Telegram
Facebook
2019 CJC P2 Q9 [Modified]
The security guard of a particular school claims that the average speed of the cars in the school compound is greater than the speed limit of $25$ km/h. To investigate the security guard’s claim, the traffic police randomly selected $50$ cars and the speed was recorded. The total speed and the standard deviation of the $50$ cars are found to be $1325$ km/h and $7.75$ km/h respectively.
(i)
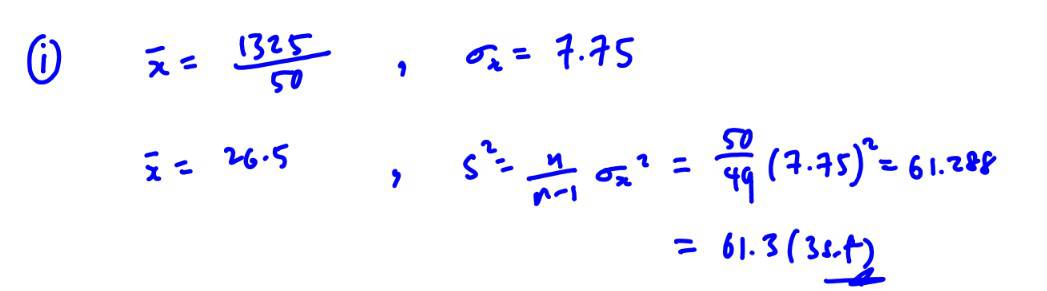
Find the unbiased estimates of the population mean and variance.
[2]
(i) Find the unbiased estimates of the population mean and variance.
[2]
(ii)
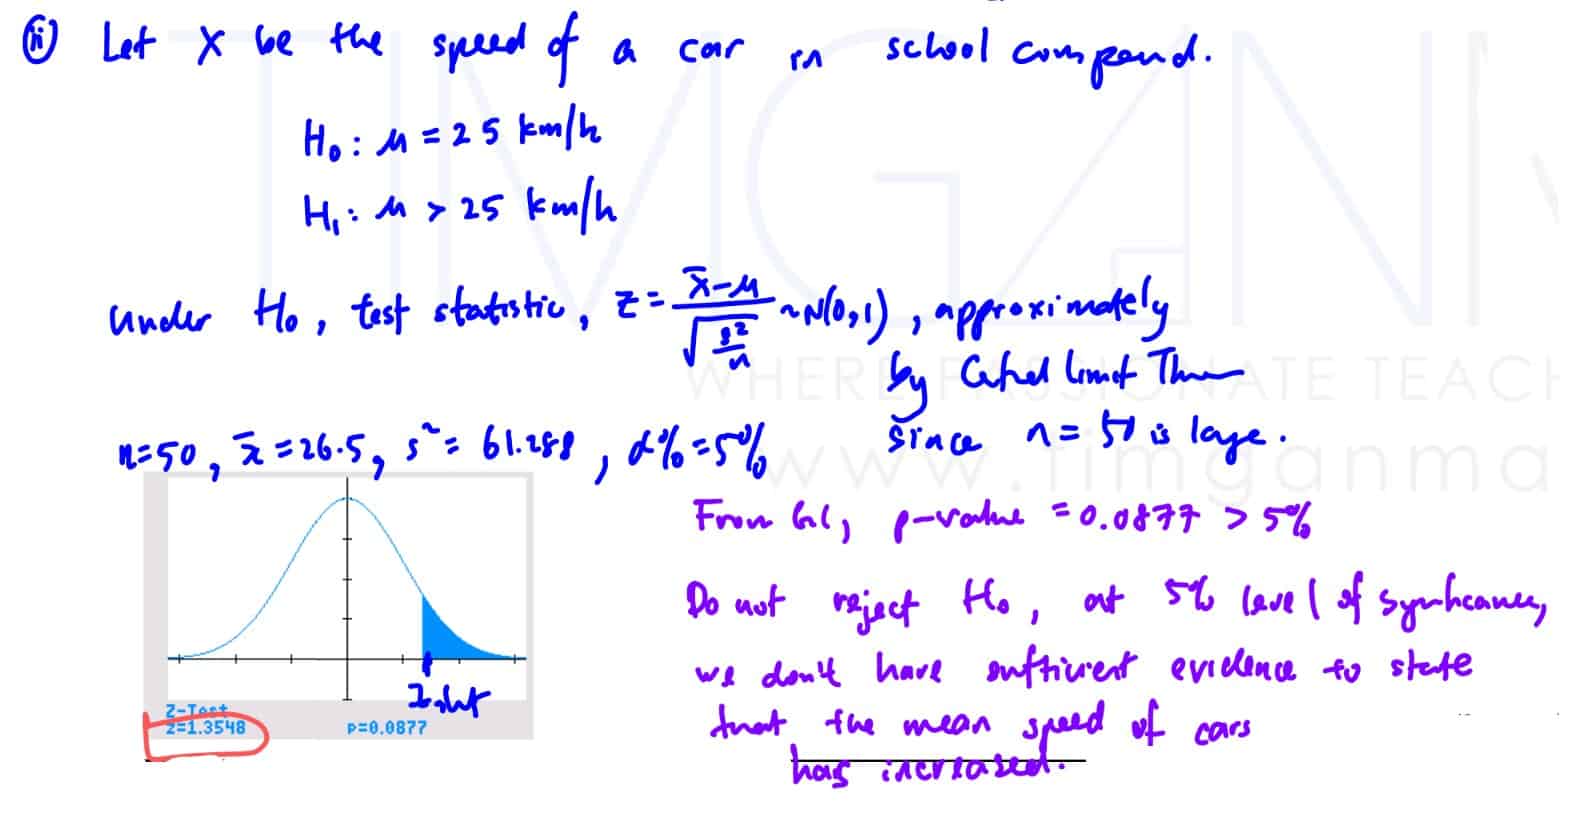
Test at $5$% level of significance whether there is sufficient evidence to support the security guard’s claim.
[4]
(ii) Test at $5$% level of significance whether there is sufficient evidence to support the security guard’s claim.
[4]
(iii)
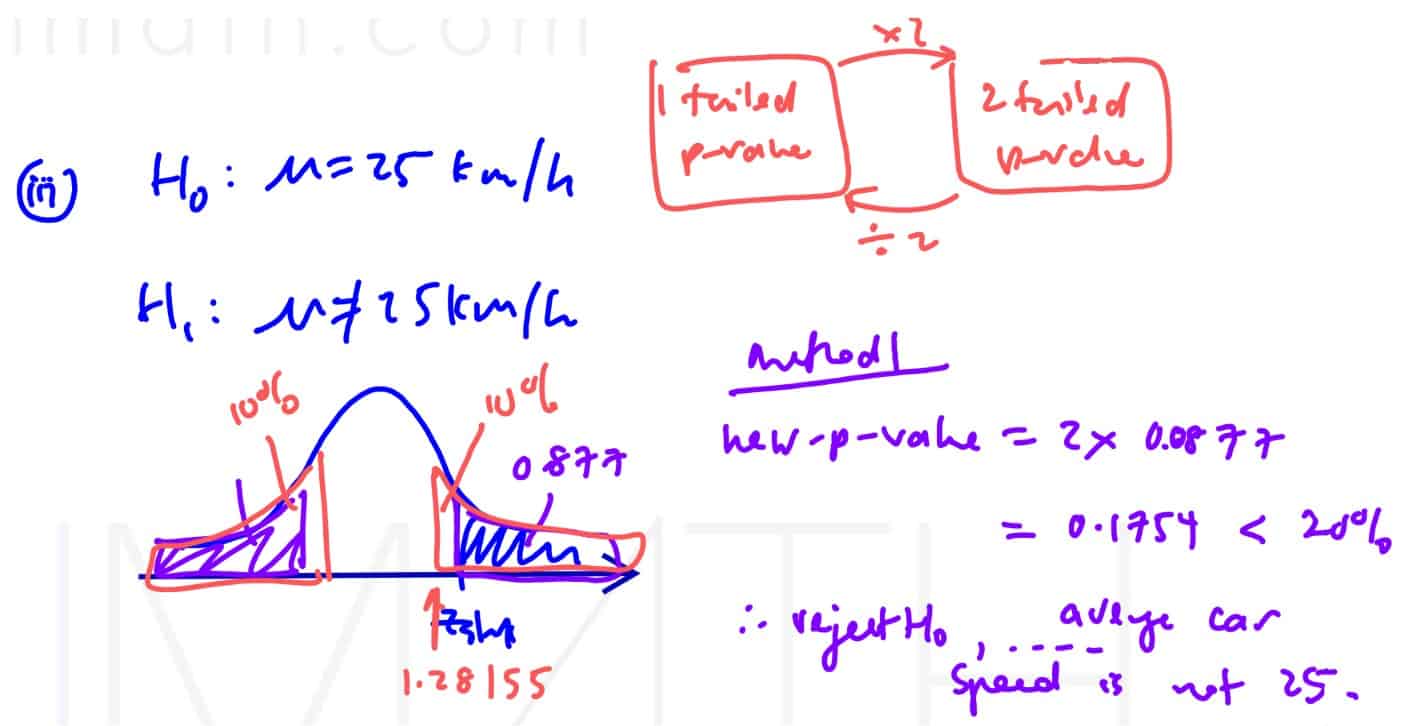
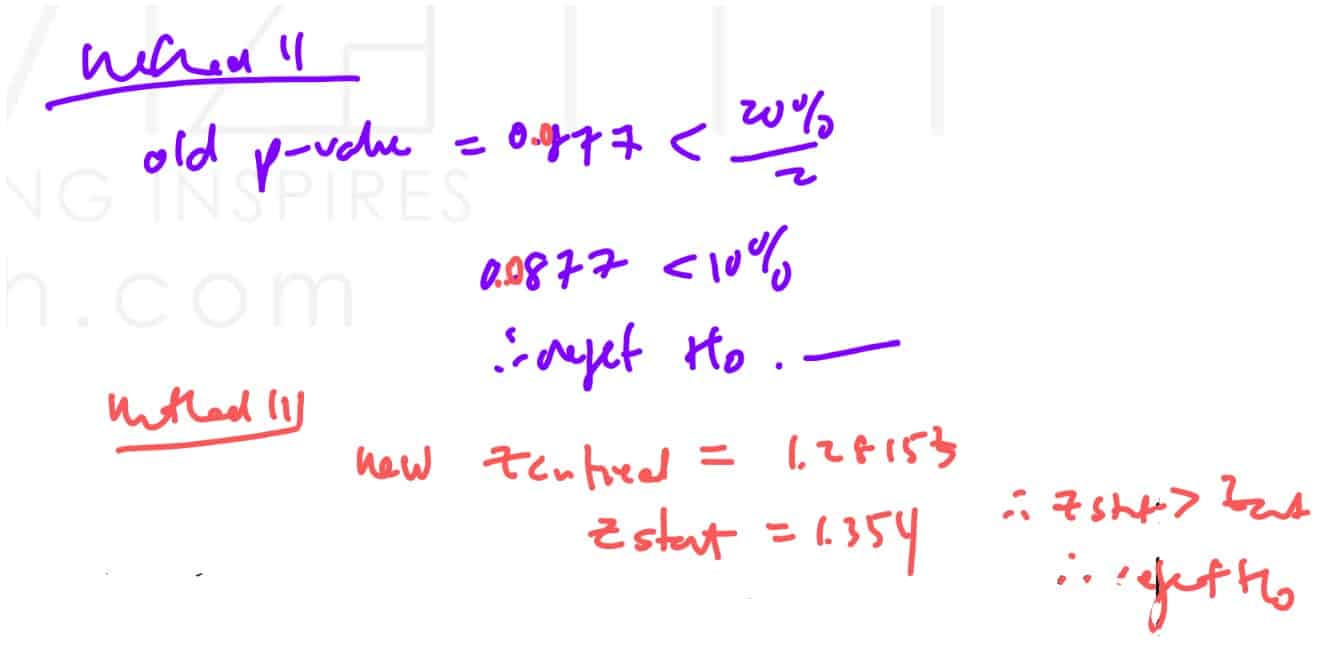
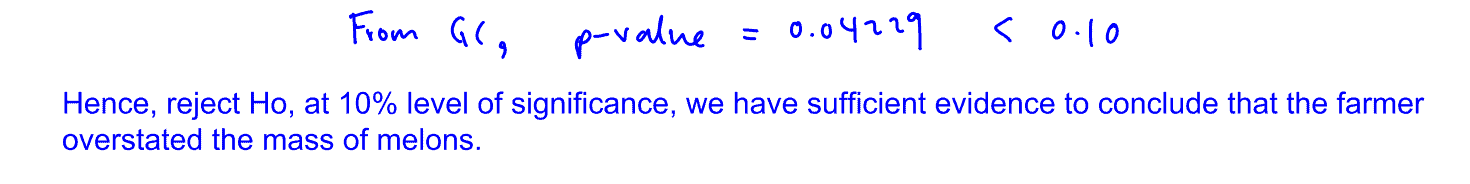
Without any further test, state the conclusion if instead the traffic police is testing that the average speed of the cars is not $25$ km/h at $20$% level of significance
[2]
(iii) Without any further test, state the conclusion if instead the traffic police is testing that the average speed of the cars is not $25$ km/h at $20$% level of significance
[2]
Suggested Handwritten and Video Solutions
(i)
(ii)
(iii)
(i)
(ii)
(iii)
Share with your friends!
WhatsApp
Telegram
Facebook
2007 IJC P2 Q11
(b)
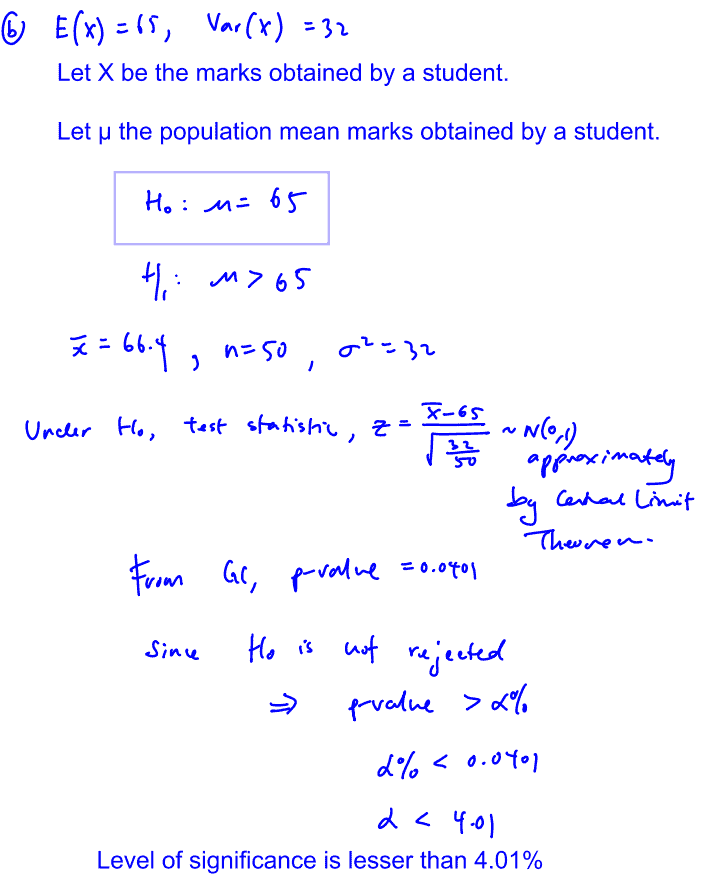
In general, the marks obtained by students in their Mathematics examination may be assumed to be a random variable with mean $65$ and variance $32$. After the introduction of a new program of revision classes, it is found that there are improvements to the marks of the some of the students.
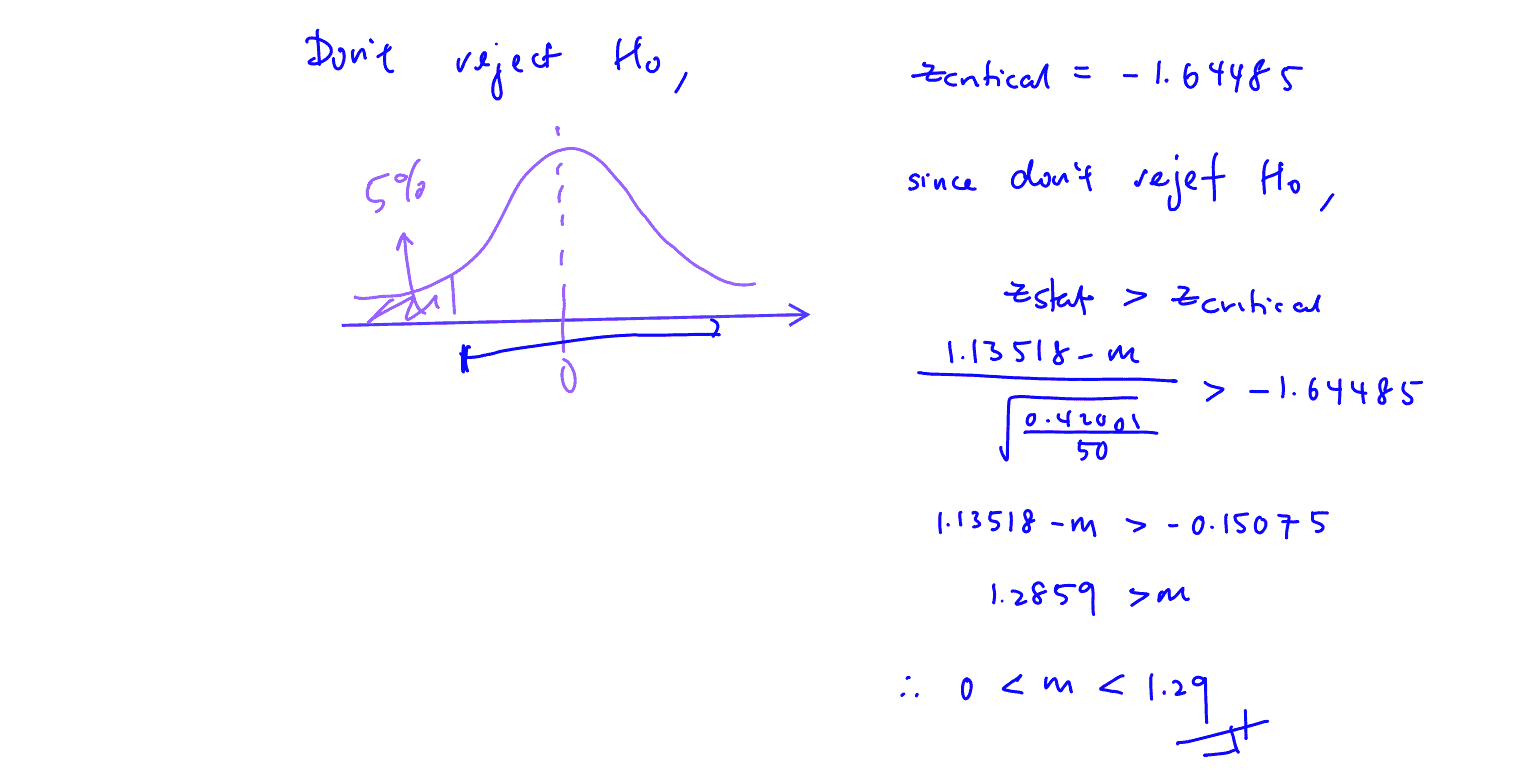
A random sample of the marks of $50$ students is taken and the mean is found to be $66.4$. A test is conducted and it shows that there is insufficient evidence that the new program of revision classes is effective. Find an inequality satisfied by the significance level of the test.
[3]
(b) In general, the marks obtained by students in their Mathematics examination may be assumed to be a random variable with mean $65$ and variance $32$. After the introduction of a new program of revision classes, it is found that there are improvements to the marks of the some of the students.
A random sample of the marks of $50$ students is taken and the mean is found to be $66.4$. A test is conducted and it shows that there is insufficient evidence that the new program of revision classes is effective. Find an inequality satisfied by the significance level of the test.
[3]
(c)
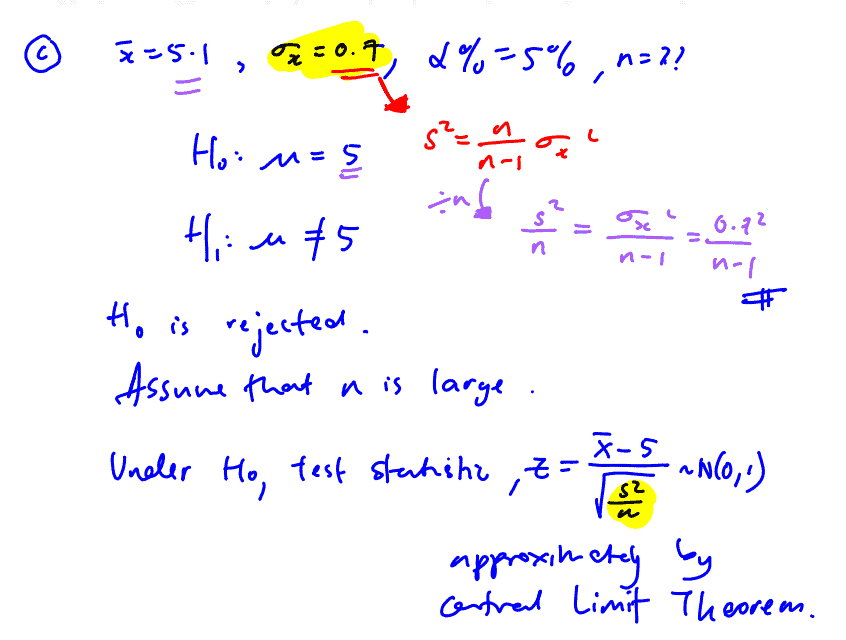
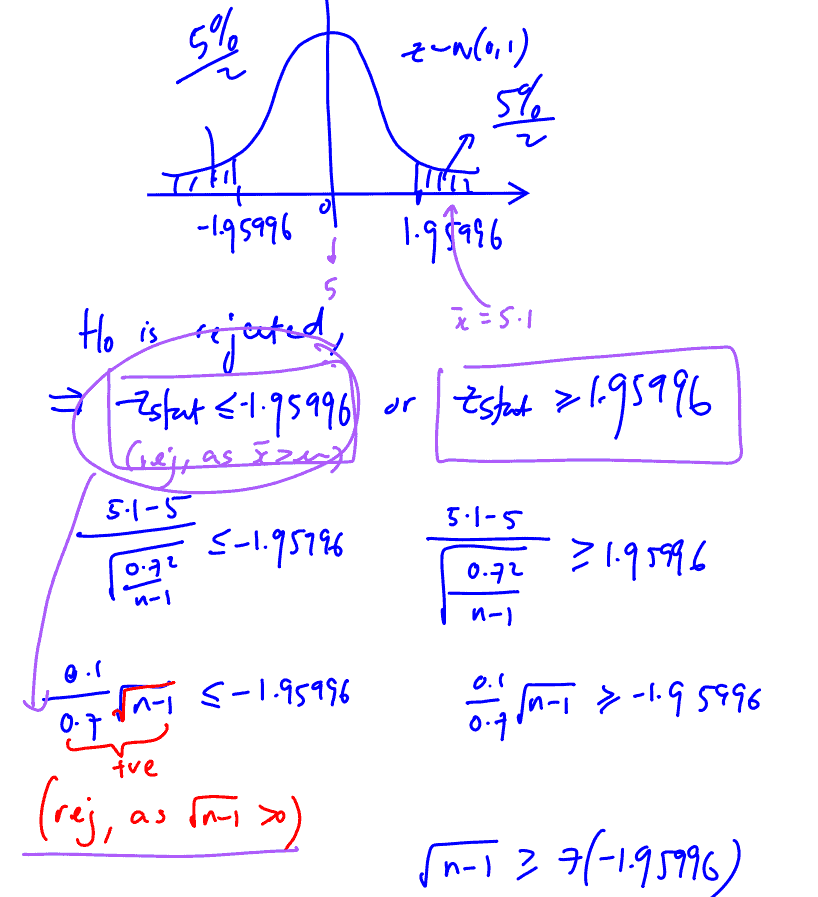
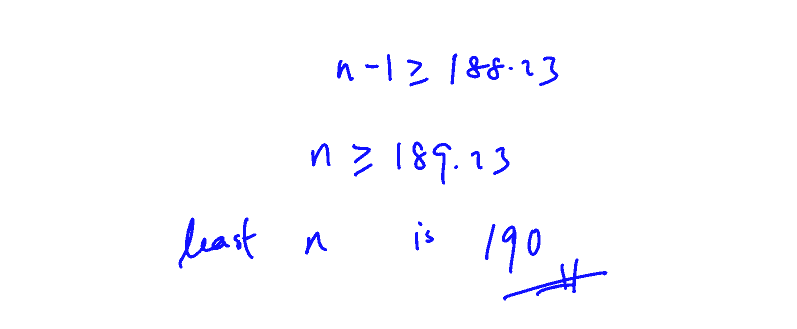
A sample of $n$ observations is taken from a population with mean $5$. The sample mean is found to be $5.1$ and sample standard deviation $0.7$. A 2-tailed normal test ($z$-test) is conducted and the null hypothesis is rejected at the $5$% significance level. Find the least value of $n$.
A sample of $n$ observations is taken from a population with mean $5$. The sample mean is found to be $5.1$ and sample standard deviation $0.7$. A 2-tailed normal test ($z$-test) is conducted and the null hypothesis is rejected at the $5$% significance level. Find the least value of $n$.
Suggested Handwritten and Video Solutions
(b)
(c)
(b)
(c)
Share with your friends!
WhatsApp
Telegram
Facebook
2015 AJC P2 Q10
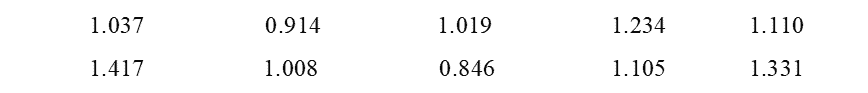
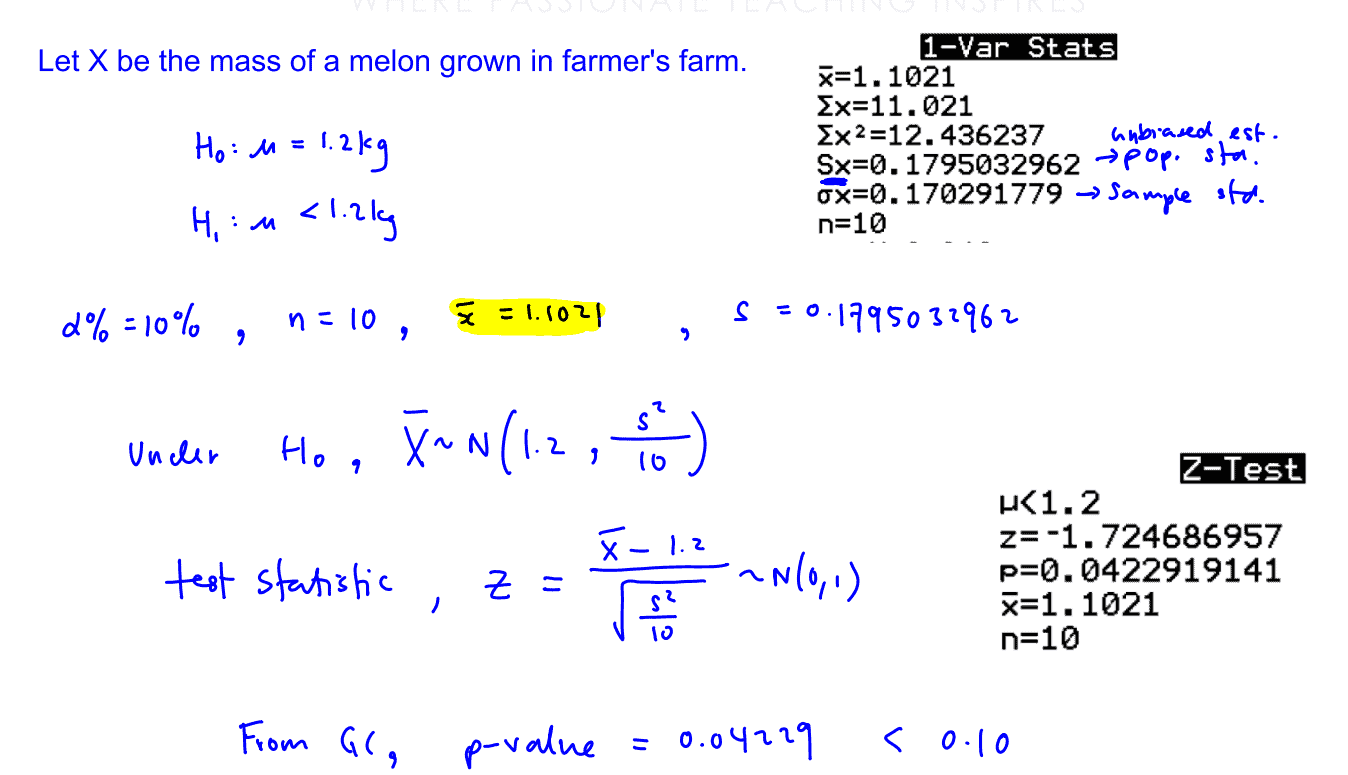
A farmer claims that the mean weight of the melons grown in his farm is at least $1.2$ kg. A random sample of $10$ melons is chosen and the weight, $x$ kg, of each melon is recorded. The results are as follows:
Assuming the weight of a randomly chosen melon follows a normal distribution, carry out an appropriate test of the farmer’s claim at the $10\%$ significance level.
[4]
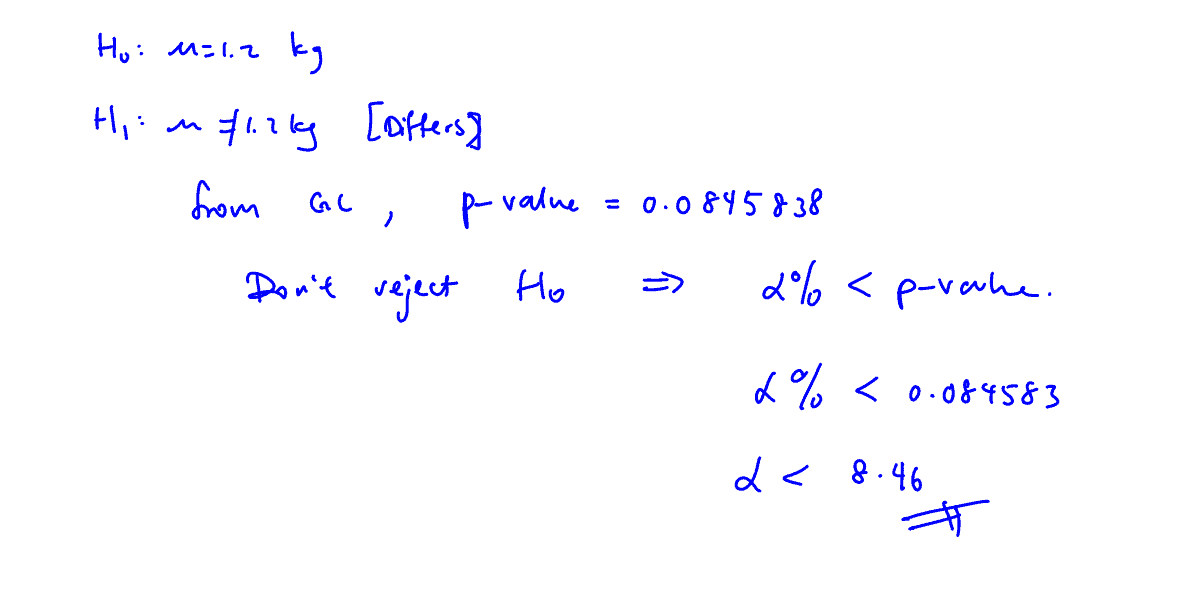
A buyer concludes that the sample could not provide sufficient evidence, at $\alpha \%$ significance level, that the mean weight differs from $1.2$kg. State the range of values of $\alpha $ for him to draw such a conclusion.
[1]
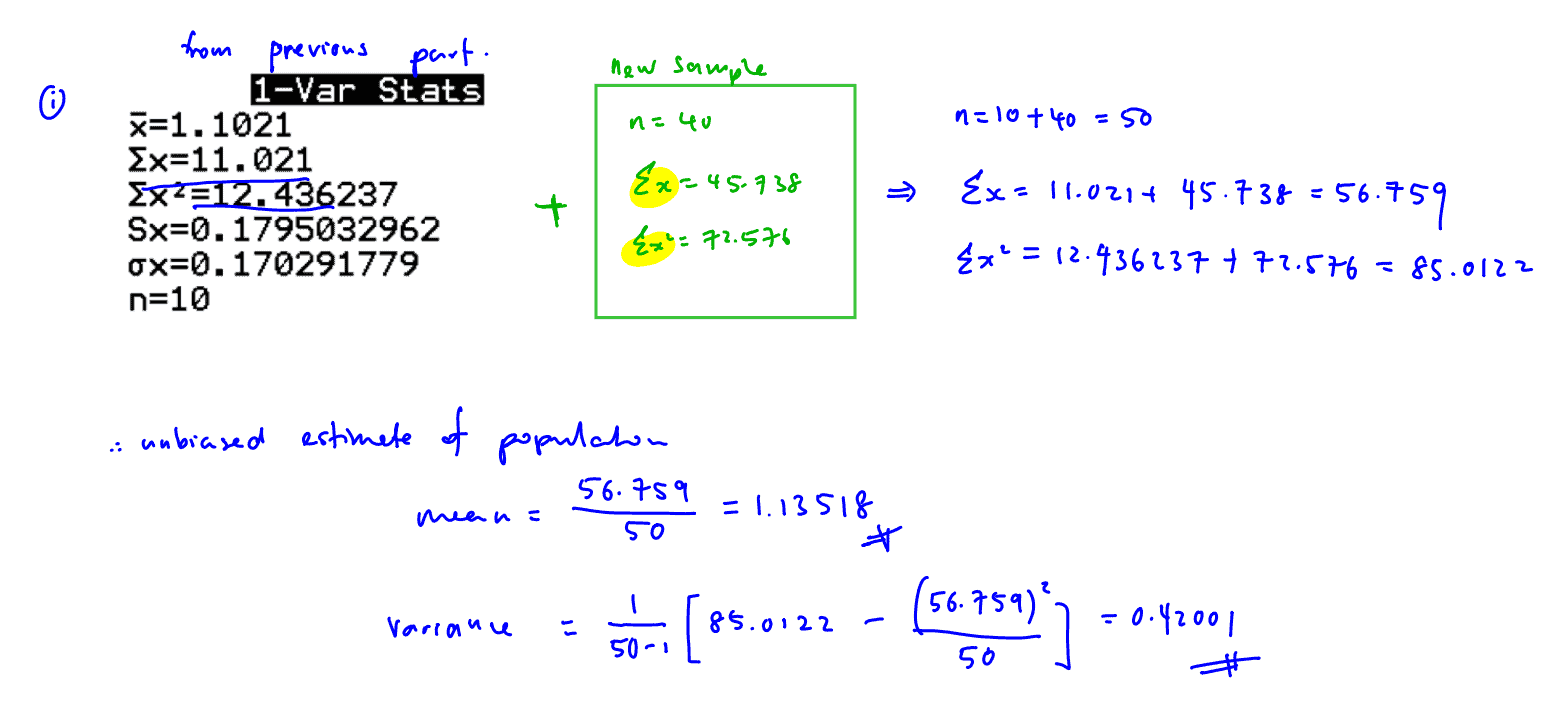
Another random sample of $40$ melons is weighed and the results are as follows:
$\sum{x=45.738}$ and $\sum{{{x}^{2}}=72.576}$
(i)
By combining the $2$ sets of data, find unbiased estimates of the population mean and population variance of the weight of a melon grown by this farmer.
[2]
(i) By combining the $2$ sets of data, find unbiased estimates of the population mean and population variance of the weight of a melon grown by this farmer.
[2]
(ii)
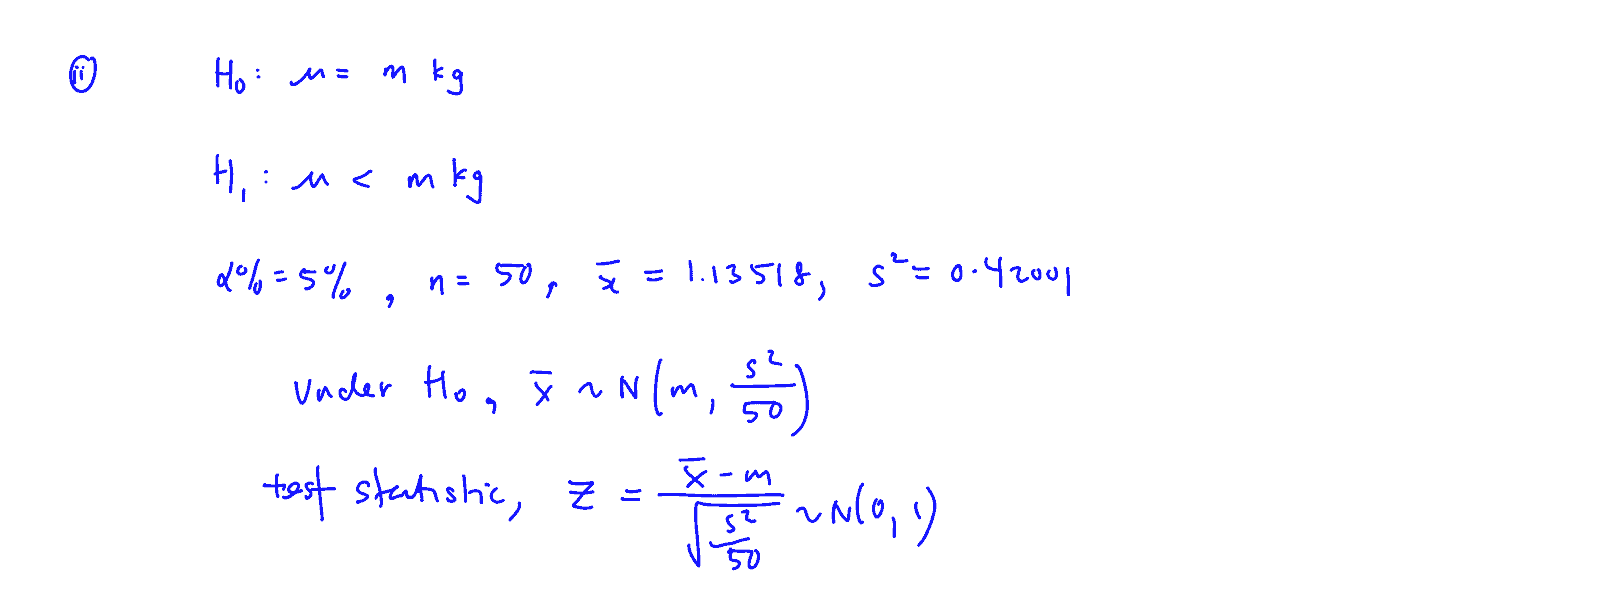
The farmer decides to change the claim to “the mean weight of the melons grown in his farm is at least $m$ kg”. Based on the combined sample of size $50$, find the set of values of $m$ for which the farmer’s claim is not rejected at the $5\%$ significance level.
[3]
(ii) The farmer decides to change the claim to “the mean weight of the melons grown in his farm is at least $m$ kg”. Based on the combined sample of size $50$, find the set of values of $m$ for which the farmer’s claim is not rejected at the $5\%$ significance level.
[3]
Suggested Handwritten and Video Solutions
-
-
-
(i)
(ii)
Part 1
Part 2
Part 3
-
-
-
(i)
(ii)
Part 1
Part 2
Part 3
Share with your friends!
WhatsApp
Telegram
Facebook
2018 EJC P2 Q8
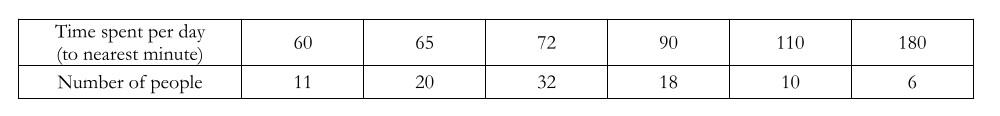
A teacher, Mr. Ku, suspects that the average time a student spends on his or her mobile phone per day is ${{\mu }_{0}}$ minutes. He selected a random sample of $97$ students in the school who own mobile phones and recorded the amount of time each student spent on his or her phone in a randomly selected day. The results are displayed in the table below.
(i)
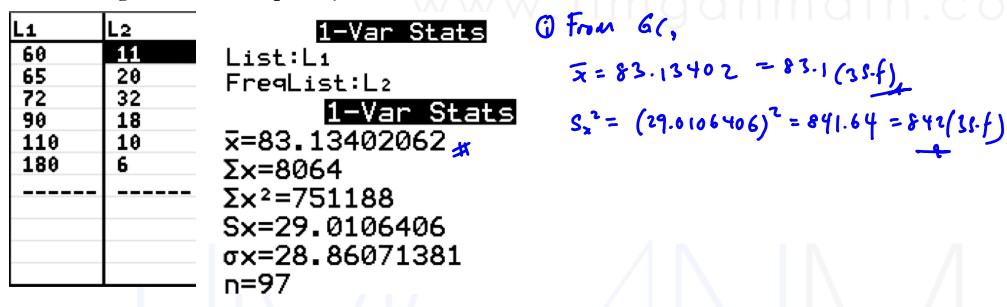
Calculate unbiased estimates of the population mean and variance of the time a student spends on his or her mobile phone per day.
[2]
(i) Calculate unbiased estimates of the population mean and variance of the time a student spends on his or her mobile phone per day.
[2]
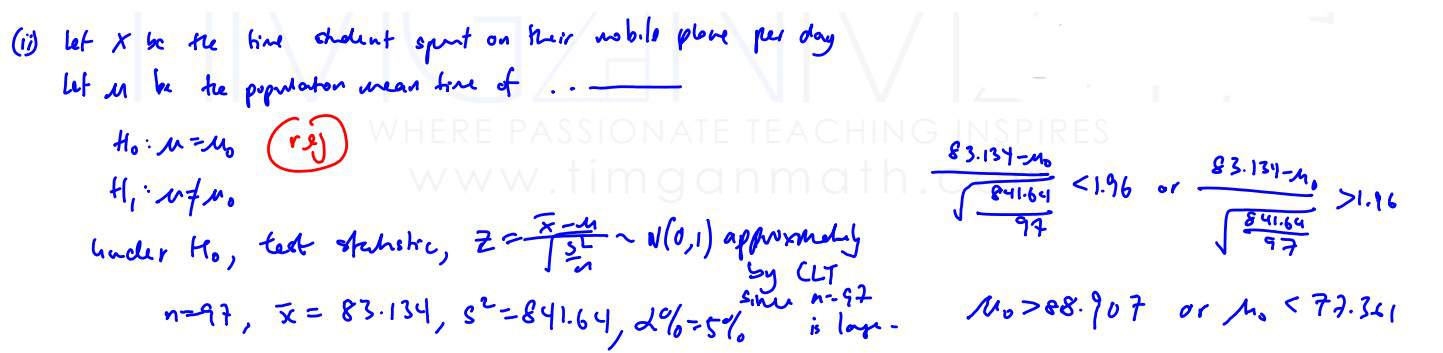
The null hypothesis that the average time a student spends on his or her mobile phone per day is ${{\mu }_{0}}$ minutes is tested, at $5\%$ level of significance, against the alternative hypothesis that the average time a student spends on his or her mobile phone per day differs from ${{\mu }_{0}}$ minutes.
(ii)
Determine the range of values of ${{\mu }_{0}}$ for which the null hypothesis is rejected.
[5]
(ii) Determine the range of values of ${{\mu }_{0}}$ for which the null hypothesis is rejected.
[5]
(iii)
Explain, in the context of this question, the meaning of ‘at $5\%$ level of significance’.
[1]
(iii) Explain, in the context of this question, the meaning of ‘at $5\%$ level of significance’.
[1]
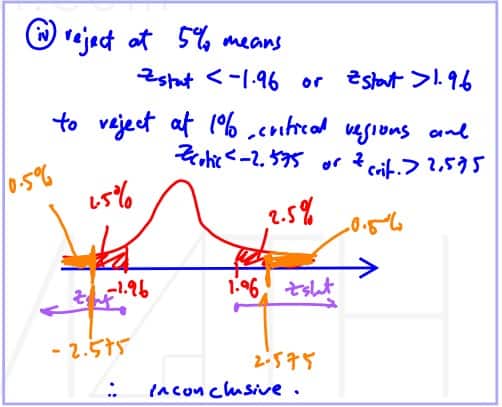
(iv)
If the null hypothesis in (ii) is rejected at $5\%$ significance level, can we reject the null hypothesis at $1\%$ level of significance? Explain your answer.
[1]
(iv) If the null hypothesis in (ii) is rejected at $5\%$ significance level, can we reject the null hypothesis at $1\%$ level of significance? Explain your answer.
[1]
Suggested Handwritten and Video Solutions
(i)
(ii)
(iii)
(iv)
$5\%$ level of significance means that there is a $0.05$ probability of concluding that the average time a student spent on their mobile phone per day differs from ${{\mu }_{0}}$ when in actual fact it did not.
(i)
(ii)
(iii)
(iv)
$5\%$ level of significance means that there is a $0.05$ probability of concluding that the average time a student spent on their mobile phone per day differs from ${{\mu }_{0}}$ when in actual fact it did not.