- Home
- Study Guides
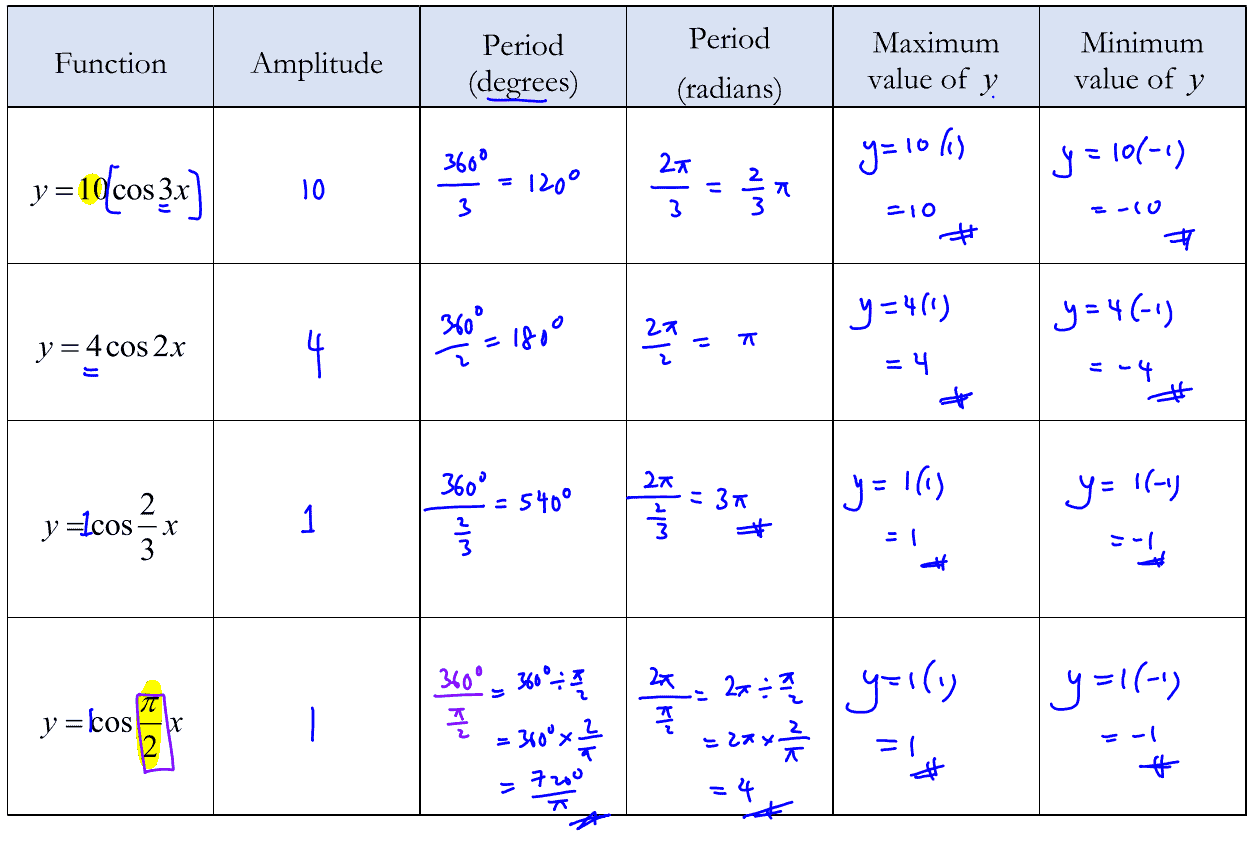
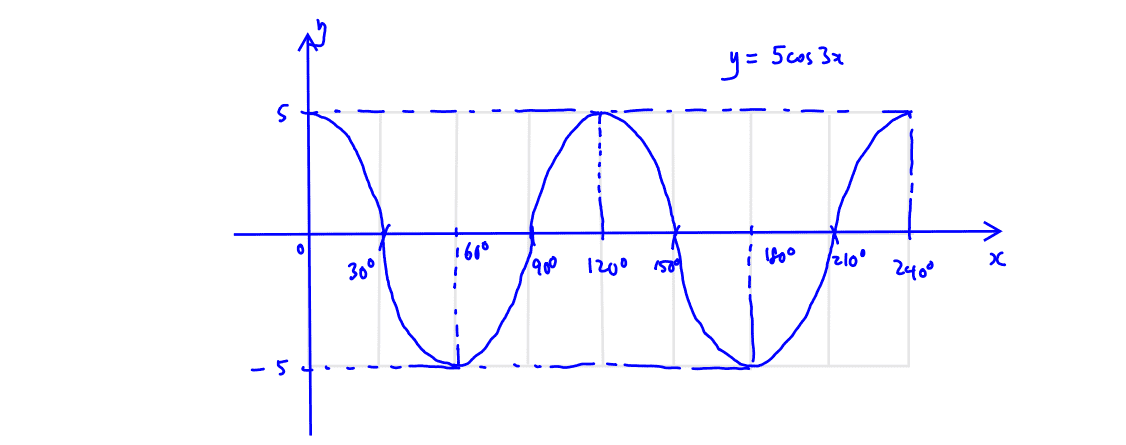
Period$=\frac{360{}^\circ }{3}=120{}^\circ ,a=5$
No. of cycles$=\frac{360^\circ}{120^\circ}=3$
 Click to enlarge image
 Click to enlarge image
Period$=\frac{360{}^\circ }{3}=120{}^\circ ,a=5$
No. of cycles$=\frac{240^\circ}{120^\circ}=2$
Click to enlarge image
 Click to enlarge image
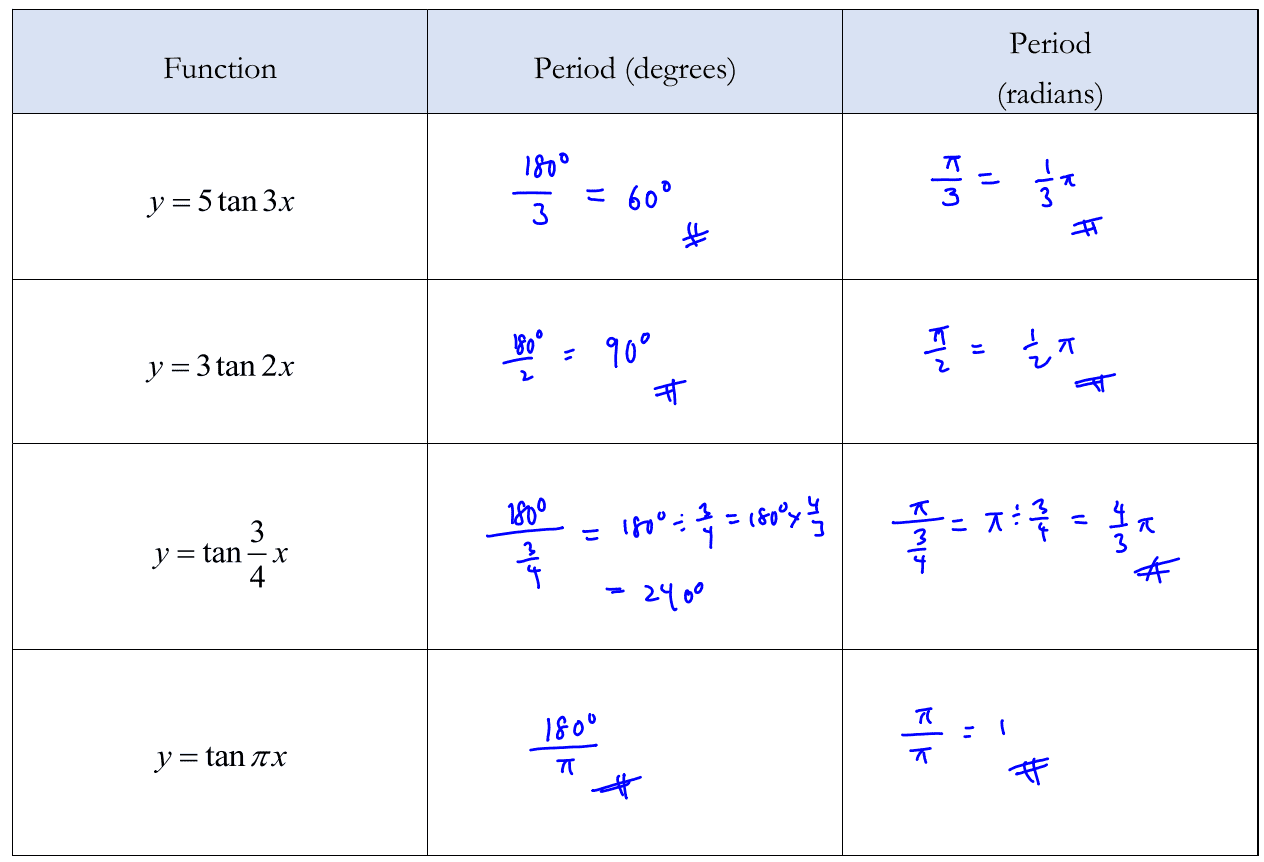
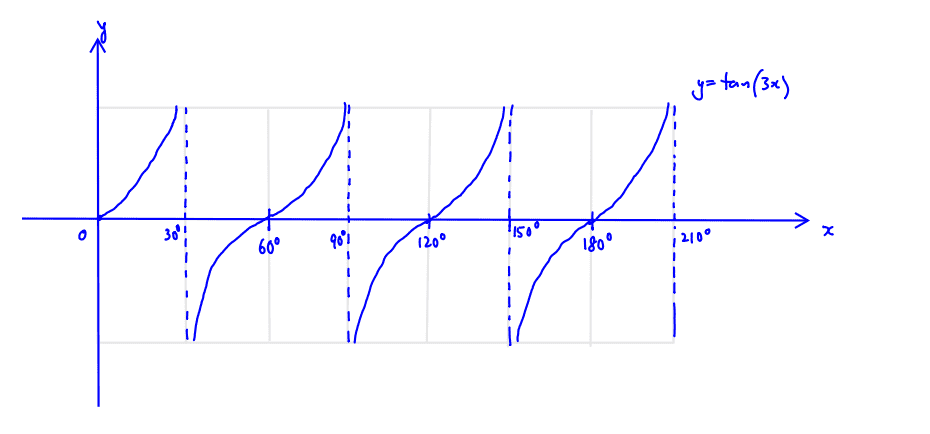
Period$=\frac{180{}^\circ }{3}=60{}^\circ $
No. of cycles$=\frac{210^\circ}{60^\circ}=\frac{7}{2}=3.5$
 Click to enlarge image
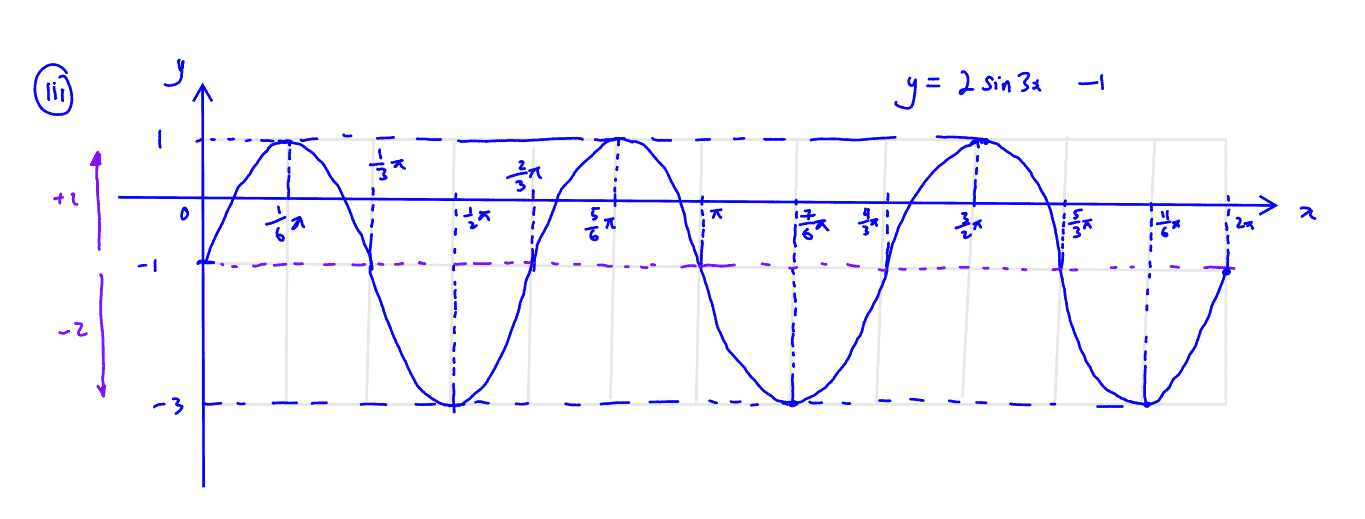
Maximum of $y=2(1)-1=1$
Minimum of $y=2(-1)-1=-3$
Amplitude $=2$
Period $=\frac{2\pi}{3}$
Range $=-3 \le y \le 1$
No. of cycles $=\frac{2\pi}{\frac{2\pi}{3}}=3$ cycles
Click to enlarge image
Maximum of $y=2(1)-1=1$
Minimum of $y=2(-1)-1=-3$
Amplitude $=2$
Period $=\frac{2\pi}{3}$
Range $=-3 \le y \le 1$
No. of cycles $=\frac{2\pi}{\frac{2\pi}{3}}=3$ cycles
Click to enlarge image
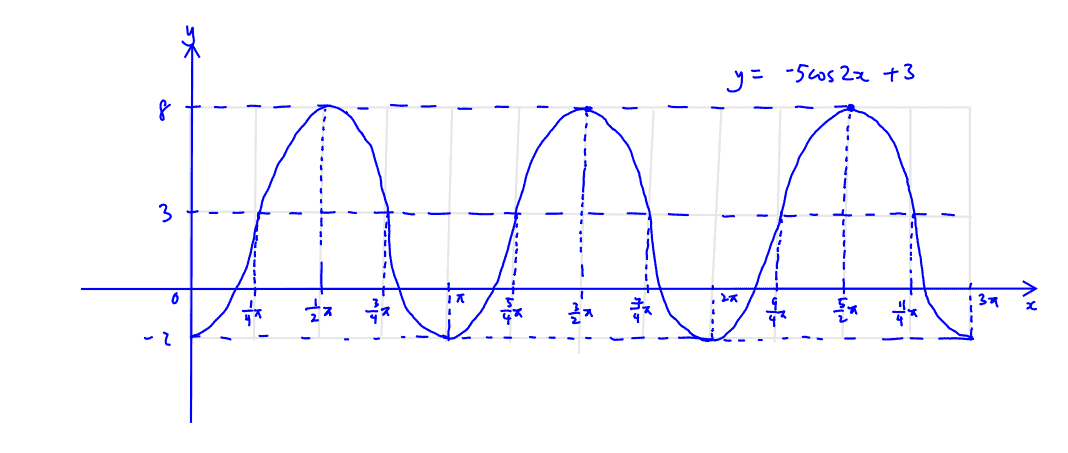
Period$=\frac{2\pi }{2}=\pi $
No. of cycles$=\frac{3\pi }{\pi }=3$
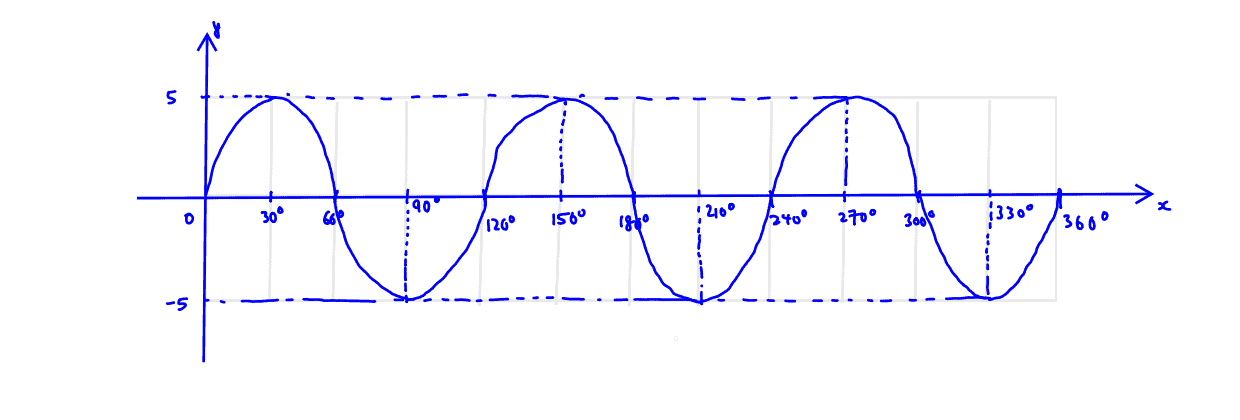
Amplitude $=\left| -5 \right|=5$
Click to enlarge image